YouTube Analytics
How to Audit a YouTube Channel in 15 Minutes
You do not need hours to know if your YouTube channel has a problem. Here is a focused 15-minute audit that tells you exactly where to look and what the numbers mean.
By Crescivo Team • July 12, 2026 • 7 min read
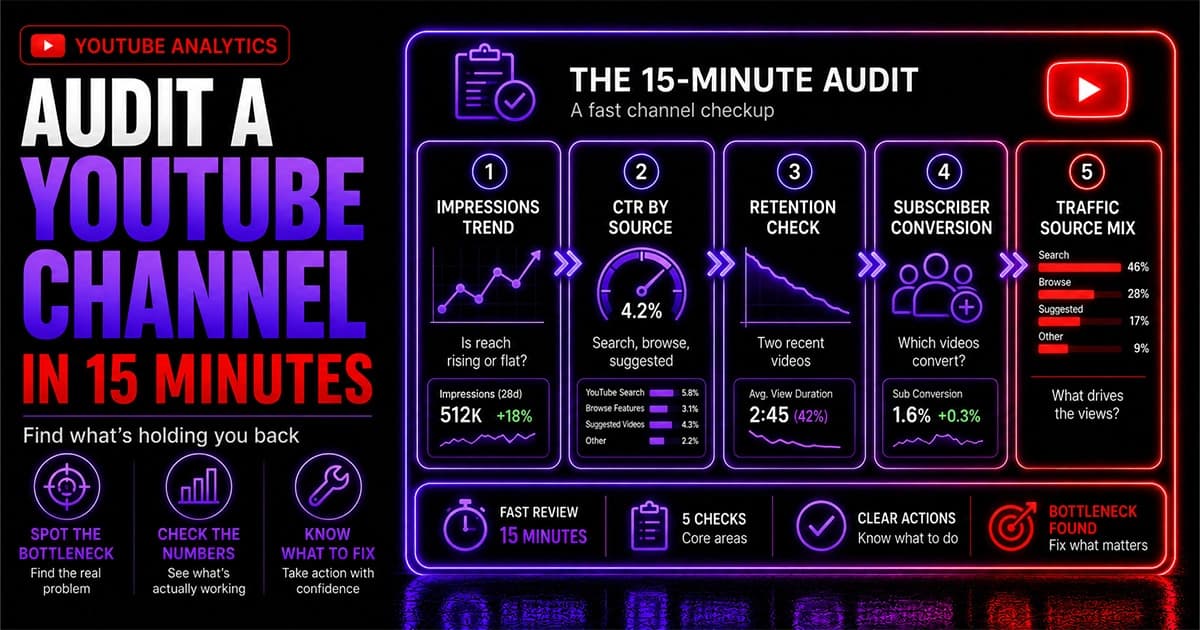
Table of contents
Most creators either never audit their channel or spend hours going down rabbit holes in YouTube Studio without a clear plan. Neither approach helps. A focused audit of the right five areas takes about 15 minutes and gives you a clear picture of where your channel is winning and where it is losing momentum.
Open YouTube Studio and work through these steps in order.
Find Your Biggest YouTube Bottleneck
Most creators guess what to fix. Run the free Channel Bottleneck Calculator and discover the one metric holding back your growth.
Run Free AnalysisMinutes 1–3: Impressions trend
Go to Analytics > Reach.
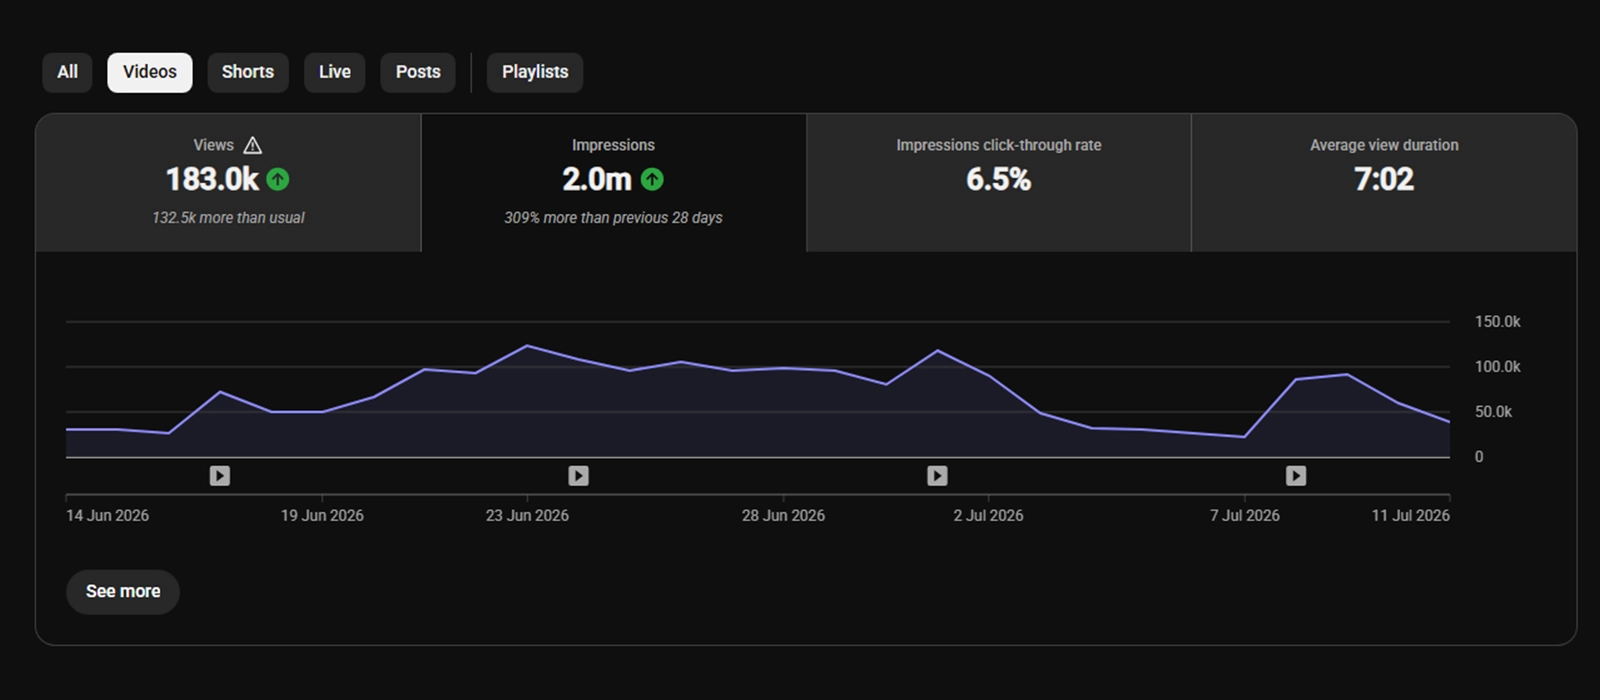
Set the date range to the last 28 days and look at your impressions graph. You are not looking for a specific number here. You are looking for the direction.
- Trending up — YouTube is showing your content to more people. Something is working.
- Flat — your reach has plateaued. Your existing content is holding steady but not expanding.
- Trending down — YouTube has pulled back on distributing your content. This is usually a packaging problem, a consistency issue, or a topic mismatch with your audience.
Note the direction and move on. You do not need to know why yet.
Minutes 4–6: CTR by traffic source
Still in the Reach tab, scroll down to the traffic sources breakdown.
Find the source driving the most impressions and note the CTR next to it. Then compare it to these rough benchmarks:
| Traffic source | Expected CTR range |
|---|---|
| YouTube search | 6% and above |
| Browse features | 3% to 6% |
| Suggested videos | 1% to 3% |
| Channel pages / playlists | Around 1% |
If your CTR is within range for your main source, packaging is not your bottleneck. If it is below range, your title or thumbnail is likely the problem, or both.
Do not look at your overall CTR average. It mixes sources that have very different expected ranges and tells you very little on its own.
Minutes 7–9: Retention on two recent videos
Go to Analytics > Content and open two of your most recent videos, one at a time.
For each one, click through to the Retention tab and look at two things:
The 30-second mark. What percentage of viewers are still watching? If it is below 70%, more than 30% of your audience dropped off in the first half-minute. That points to a weak hook, a slow opener, or a mismatch between what the title promised and what the video opened with.
Any sharp drops after that. A gradual decline throughout a video is normal. Sudden drops of 3% or more at a specific timestamp are worth noting. They usually mark a transition, a section that drags, or a moment where the viewer felt the video had already ended.
Minutes 10–12: Subscriber conversion
Go to Analytics > Audience.
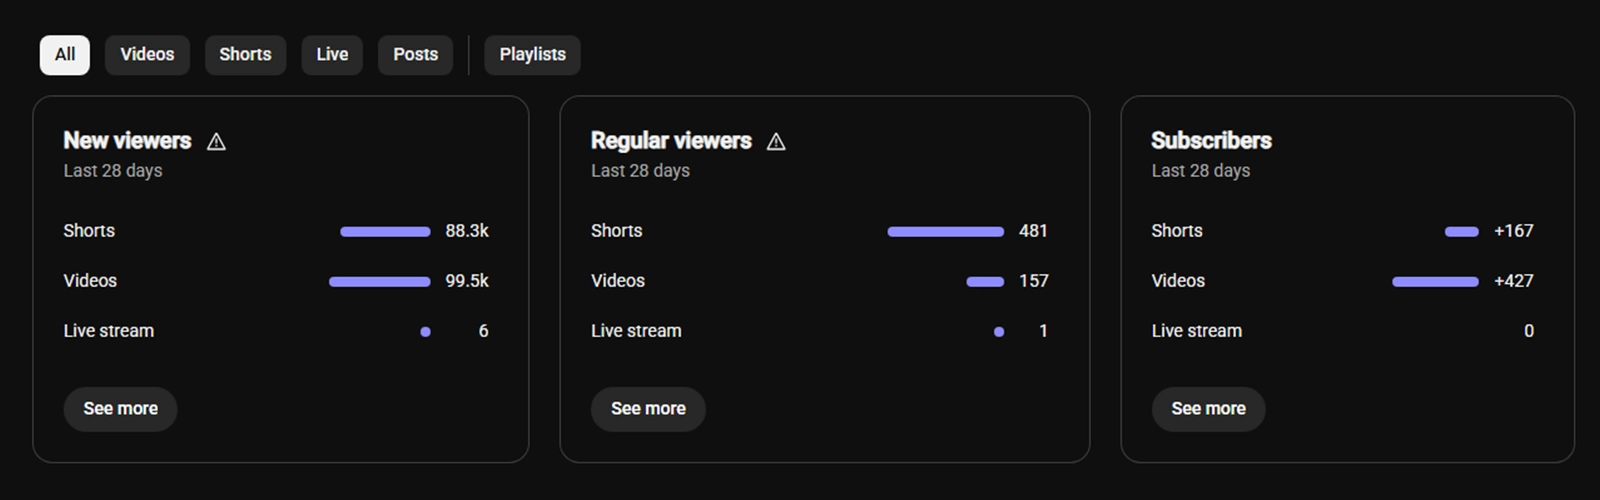
Look at how many new subscribers you gained over the last 28 days, then scroll down to see which individual videos drove the most subscriptions.
Two things to note:
- Is there a specific video or topic that converts subscribers significantly better than others? If so, that is a signal about what your audience actually wants from your channel.
- Are you gaining subscribers at a rate that feels proportionate to your views? A channel getting solid views but very few new subscribers often has an audience fit problem, where the content is attracting viewers who are not interested in coming back.
Minutes 13–15: Traffic source mix
Back in the Reach tab, look at the full breakdown of your traffic sources, not just the top one.
You want to understand how your views are distributed. A channel that gets almost all of its views from YouTube search is growing through SEO. That is stable and predictable but tends to scale slowly. A channel with strong browse and suggested traffic is being pushed by YouTube's recommendation system, which can grow fast but is harder to predict.
Note which sources are contributing and which are near zero. A channel that has no browse or suggested traffic at all has not yet broken through into YouTube's recommendation system, which is a separate problem from search performance. A channel entirely dependent on one source is more vulnerable if that source shifts.
What to do with your findings
By now you have five data points: impressions trend, CTR vs benchmark, retention at 30 seconds, subscriber conversion, and traffic source mix.
The priority is to fix them in order. Impressions first, then CTR, then retention, then conversion. Working on retention when your impressions are critically low does not move the needle. Fixing the earliest breaking point in the chain is what actually changes the numbers.
If you want to go deeper on any of these areas, the YouTube Channel Audit Checklist covers each metric in full, including what benchmarks to aim for and how to diagnose specific problems within each area.
Find your YouTube bottleneck in minutes
The free Crescivo Bottleneck Calculator checks every stage of your channel and shows you exactly where to focus first.
Get Started FreeFAQ
How do I audit a YouTube channel?+
Open YouTube Studio and check five things in order: your impressions trend over the last 28 days, your CTR compared to the expected range for your main traffic source, your retention at the 30-second mark on recent videos, which videos are driving subscriber conversions, and your traffic source mix. The whole process takes about 15 minutes and tells you where your channel is losing momentum.
What should I look for when auditing a YouTube channel?+
You are looking for where the viewer journey breaks down. Start with impressions — is YouTube showing your content to enough people? Then CTR — are they clicking when they see it? Then retention — are they watching once they click? Then subscriber conversion — are viewers becoming subscribers? Fix the first stage that is underperforming before moving to the next.
How often should I audit my YouTube channel?+
A quick 15-minute review every month gives you enough visibility to catch problems early without turning analytics into a distraction. Checking individual video performance weekly is also useful, especially in the first few days after upload when early signals tell you how the algorithm is responding.
What is a good retention rate for YouTube?+
At minimum, 70% of viewers should still be watching at the 30-second mark, meaning no more than 30% drop off in the first half minute. For average view duration, 30% of total video length is a starting baseline. Higher is always better, but those are the numbers worth working toward before focusing on other metrics.
Why is my YouTube channel not growing?+
Growth stalls at one of five stages: impressions, CTR, retention, subscriber conversion, or business conversion. Run through each one in YouTube Studio and find the stage where the numbers fall below a reasonable range. That is your bottleneck. Fixing everything at once rarely works. Fixing the right thing first does.
What to do next
Set aside 15 minutes, open YouTube Studio, and work through the five steps above. Write down one number from each area and identify which stage looks the weakest. That is where to focus first.
Find Your Biggest YouTube Bottleneck
Most creators guess what to fix. Run the free Channel Bottleneck Calculator and discover the one metric holding back your growth.
Run Free AnalysisRelated Articles
More guides to help you diagnose and improve your YouTube growth.
YouTube Analytics
YouTube Retention Rate: What's Good, What's Bad, and How to Fix It
Most creators check their YouTube retention rate too early or compare it to the wrong benchmark. Here is what good retention actually looks like and how to improve it.

YouTube Strategy
The YouTube Description Template That Ranks and Converts
Most YouTube descriptions are either ignored or stuffed with keywords. Here is the template that helps your videos rank on search and turn viewers into leads or subscribers.
YouTube Growth
How to Get Your First 100 YouTube Subscribers
Getting your first 100 YouTube subscribers puts you in the top 25% of all channels. Here is how to get there through search, discovery, and the right content strategy.
Find Your Biggest YouTube Bottleneck
Most creators guess what to fix. Run the free Channel Bottleneck Calculator and discover the one metric holding back your growth.
Run Free Analysis